Warning: Undefined array key "lng" in /home/.sites/327/site3343342/web/wetter/monthly.php on line 287
Go to: April 2012 or June 2012
Monthly Overview for May 2012.
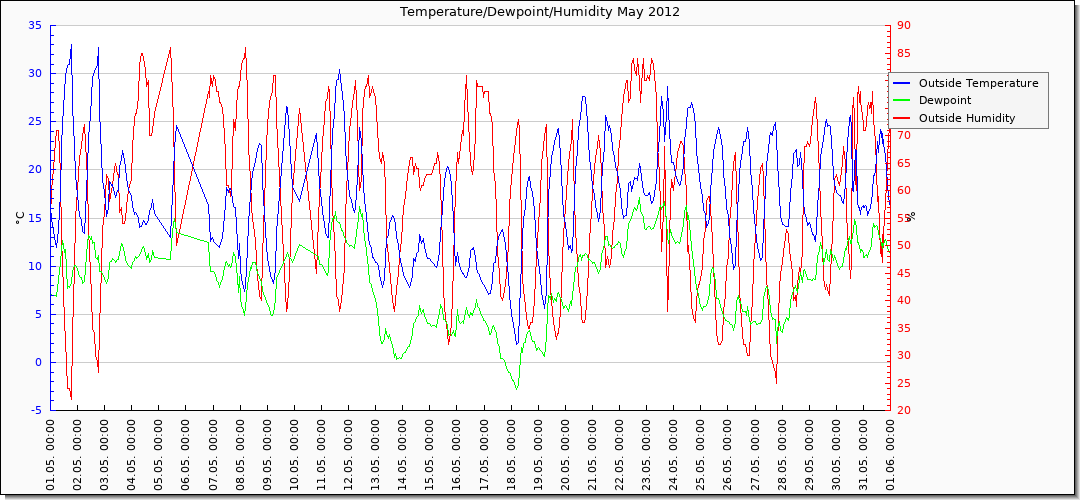
Graphs Average Values Minimum Values Maximum Values All ValuesThe average temperature was 17.16 °C in May.
This means it was by 0.66 °C warmer then in the long-time average of 16.50 °C (read more)
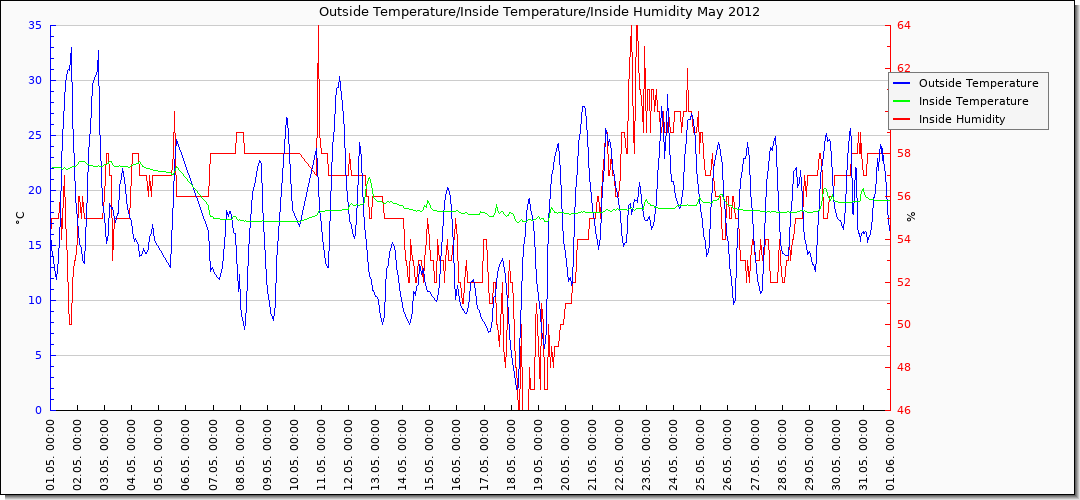
The highest temperature was measured on 01.05 at 18:30 with 33.00 °C.
The lowest temperature appeared on 18.05 at 05:00 and was 1.90 °C.
The warmest day has been the 02.05 with an average temperature of 22.50 °C.
The coldest day was the 16.05 with an average of 9.86 °C.
There was 0 ice-day(s) (highest temp. max. 0 °C) (),
0 frost-day(s) (lowest temp. max. 0 °C) (),
15 summer-day(s) (highest temp. at least 25 °C) (02,03,09,10,12,20,21,22,24,25,26,27,28,30,31),
3 heat-day(s) (highest temp. at least 30 °C) (01,02,11),
0 tropical night(s) (lowest temp. at least 20 °C) ().
The dewpoint was in the average of the month at 8.49 °C.
The highest dewpoint was reached on 23.05 at 16:45 with 17.90 °C.
The lowest dewpoint was measured on 18.05 at 05:00 with -2.80 °C.
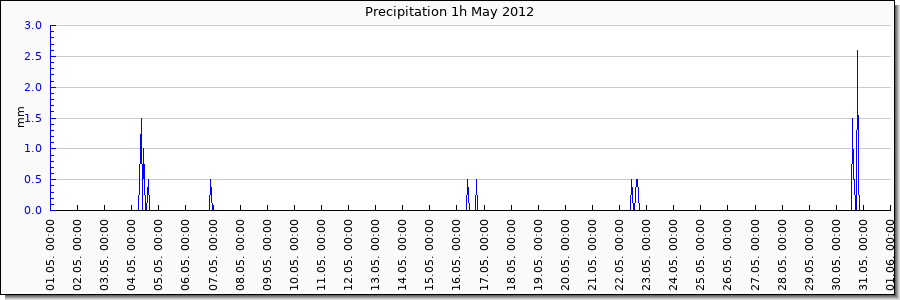
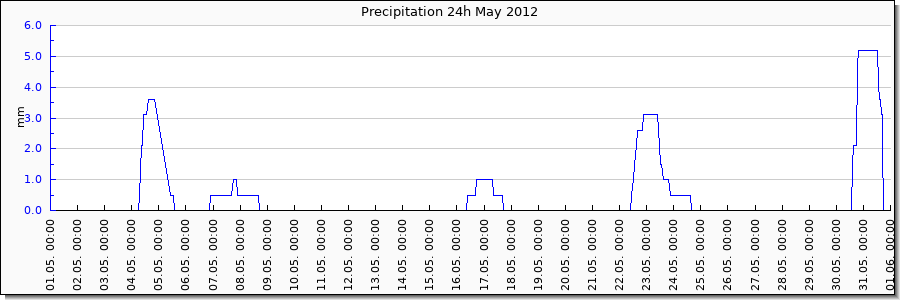
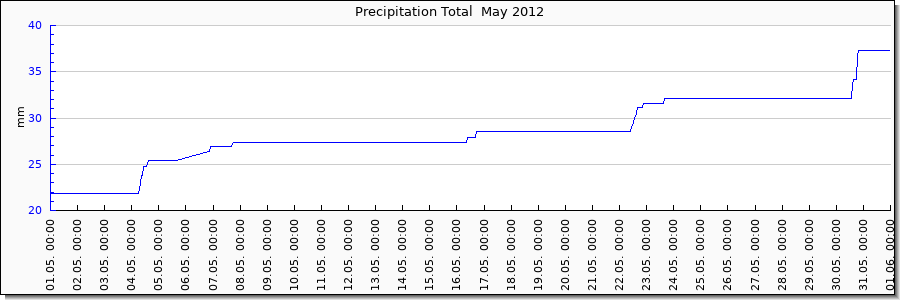
There was a precipitation of 15.50 mm, 24.60 % of the long-time average of 63 mm.
The day with the most precipitation was 30.05 with 5.20 mm.
No precipitation happened on 24 day(s) (01,02,03,05,08,09,10,11,12,13,14,15,17,18,19,20,21,24,25,26,27,28,29,31).
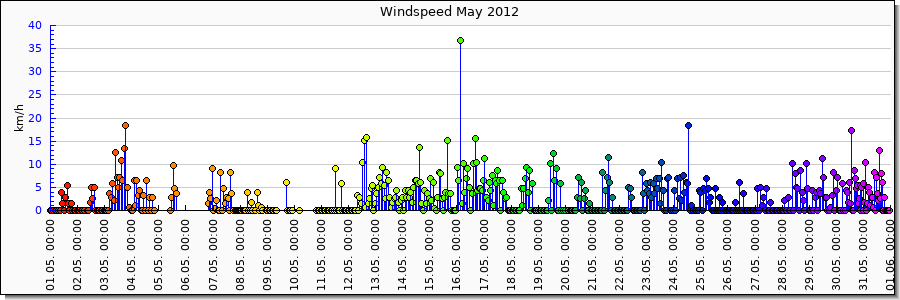
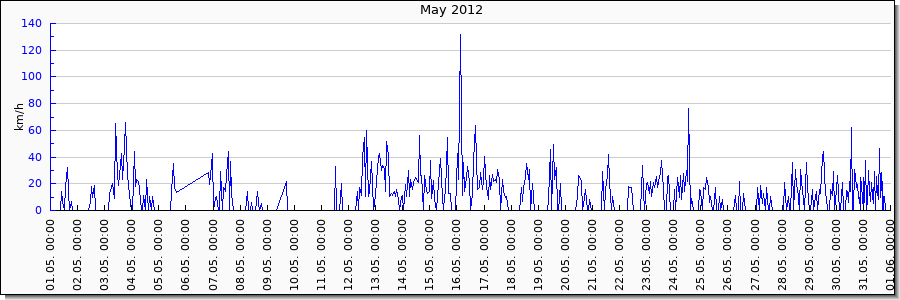
The average windspeed in May was 2.70 km/h (1 bft - Light Air).
The strongest wind was measured on 16.05 at 03:15 with 36.72 km/h (5 bft - Fresh Breeze).
The windiest day was 16.05 with an average windspeed of 7.46 km/h (1 bft - Light Air).
The day with the least wind was 10.05 with an average of 0.00 km/h (0 bft - Calm).
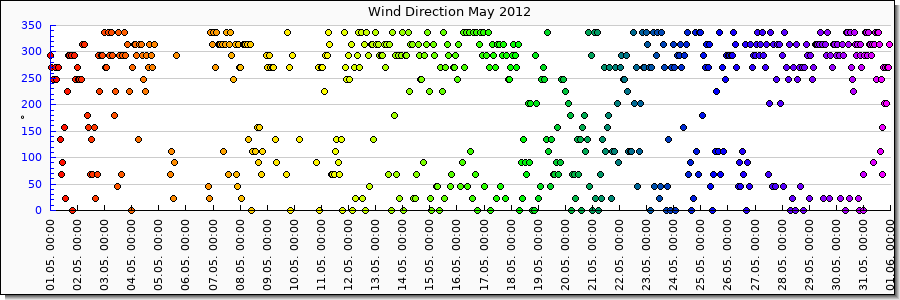
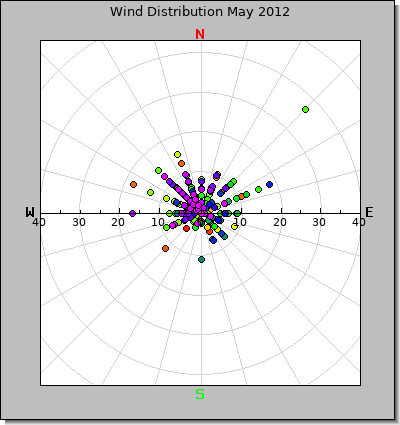
The wind came most of the time from South-West (212.82).
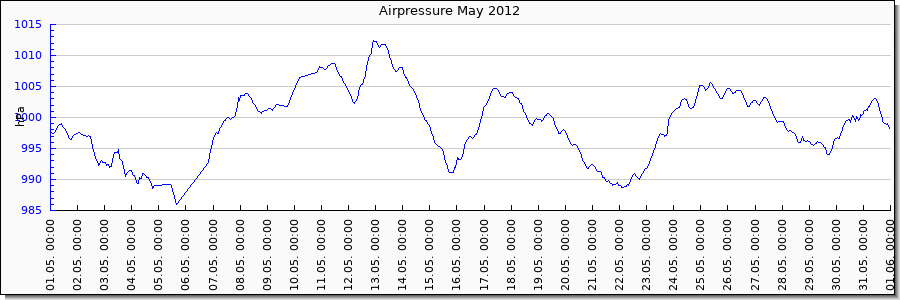
The average, to normal zero reduced airpressure was at 999.17 hPa.
The highst airpressure was measured on 12.05 at 22:30 with 1012.50 hPa.
The lowest airpressure appeared on 05.05 at 15:15 with 985.90 hPa.
Graphs for May 2012.
 Warning: Undefined array key "windmax" in /home/.sites/327/site3343342/web/wetter/weatherInclude.php on line 600
Top
Average Values for May 2012.
| Date | Time | Temp In (°C) | Temp Out (°C) | Dew (°C) | Hum In (%) | Hum Out (%) | Windspeed (m/s) |
Warning: Undefined array key "windmax_table" in /home/.sites/327/site3343342/web/wetter/weatherInclude.php on line 731
| Wind Angle (°) | Wind Chill (°C) | Airpressure (hPa) | Rain 1h (mm) | Rain 24h (mm) | Rain overall |
| --.--.-- | --:--:-- | 18.84 | 17.16 | 8.49 | 55.49 | 59.10 | 0.75 | 3.15 | 212.82 | 16.97 | 999.17 | 0.02 | 0.52 | 28.93 |
Top
Minimum Values for May 2012.
| Date | Time | Temp In (°C) | Temp Out (°C) | Dew (°C) | Hum In (%) | Hum Out (%) | Windspeed (m/s) |
Warning: Undefined array key "windmax_table" in /home/.sites/327/site3343342/web/wetter/weatherInclude.php on line 731
| Wind Angle (°) | Wind Chill (°C) | Airpressure (hPa) | Rain 1h (mm) | Rain 24h (mm) | Rain overall |
| | 17.00 | 1.90 | -2.80 | 44.00 | 22.00 | 0.00 | 0.00 | 0.00 | 0.70 | 985.90 | 0.00 | 0.00 | 21.80 |
| Time | 07:00:17 | 05:00:25 | 05:00:25 | 13:15:17 | 18:30:15 | 00:00:21 | 00:00:21 | 18:00:19 | 03:15:35 | 15:15:22 | 00:00:21 | 00:00:21 | 00:00:21 |
| Date | | 2012-05-10 | 2012-05-18 | 2012-05-18 | 2012-05-18 | 2012-05-01 | 2012-05-01 | 2012-05-01 | 2012-05-01 | 2012-05-16 | 2012-05-05 | 2012-05-01 | 2012-05-01 | 2012-05-01 |
Top
Maximum Values for May 2012.
| Date | Time | Temp In (°C) | Temp Out (°C) | Dew (°C) | Hum In (%) | Hum Out (%) | Windspeed (m/s) |
Warning: Undefined array key "windmax_table" in /home/.sites/327/site3343342/web/wetter/weatherInclude.php on line 731
| Wind Angle (°) | Wind Chill (°C) | Airpressure (hPa) | Rain 1h (mm) | Rain 24h (mm) | Rain overall |
| | 22.60 | 33.00 | 17.90 | 64.00 | 87.00 | 10.20 | 36.70 | 337.50 | 33.00 | 1012.50 | 2.60 | 5.20 | 37.30 |
| Time | 01:15:25 | 18:30:15 | 16:45:23 | 21:15:13 | 09:30:15 | 03:15:35 | 03:15:35 | 06:30:25 | 18:30:15 | 22:30:15 | 18:20:22 | 18:50:16 | 18:50:16 |
| Date | | 2012-05-02 | 2012-05-01 | 2012-05-23 | 2012-05-10 | 2012-05-05 | 2012-05-16 | 2012-05-16 | 2012-05-01 | 2012-05-01 | 2012-05-12 | 2012-05-30 | 2012-05-30 | 2012-05-30 |
Top
Show all values
Go to: April 2012 or June 2012