Warning: Undefined array key "lng" in /home/.sites/327/site3343342/web/wetter/monthly.php on line 287
Go to: June 2012 or August 2012
Monthly Overview for July 2012.
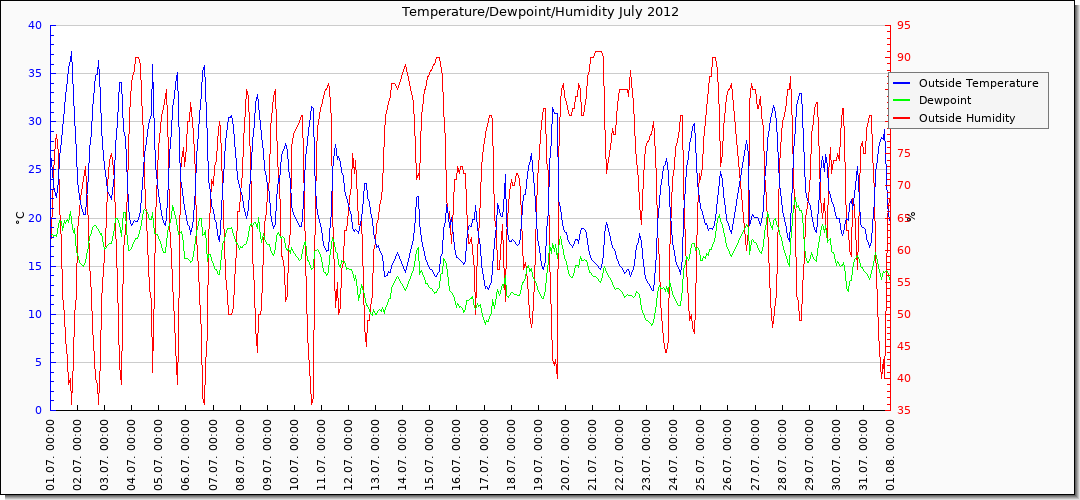
Graphs Average Values Minimum Values Maximum Values All ValuesThe average temperature was 21.81 °C in July.
This means it was by 0.11 °C warmer then in the long-time average of 21.70 °C (read more)
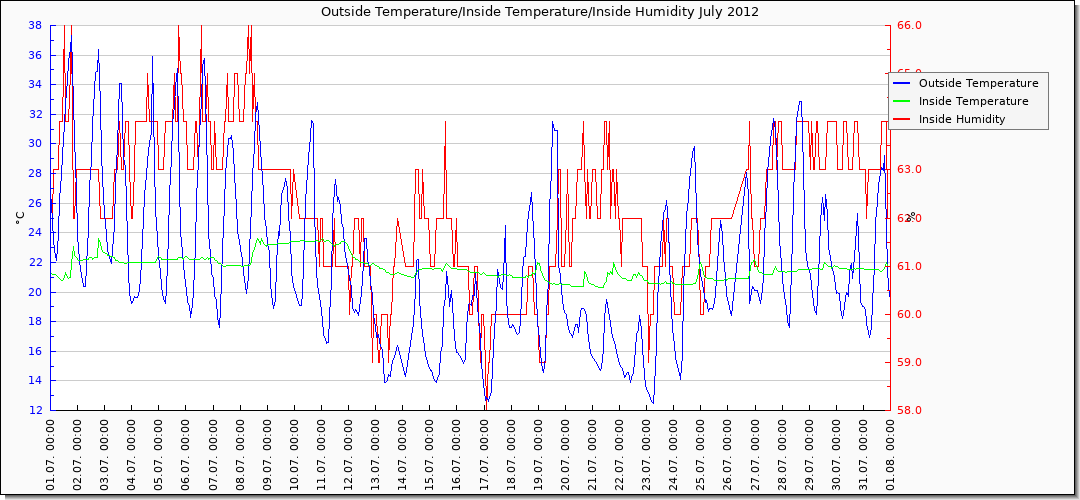
The highest temperature was measured on 01.07 at 18:40 with 38.80 °C.
The lowest temperature appeared on 17.07 at 04:30 and was 12.40 °C.
The warmest day has been the 01.07 with an average temperature of 29.05 °C.
The coldest day was the 13.07 with an average of 15.38 °C.
There was 0 ice-day(s) (highest temp. max. 0 °C) (),
0 frost-day(s) (lowest temp. max. 0 °C) (),
21 summer-day(s) (highest temp. at least 25 °C) (02,03,04,05,06,07,08,09,10,11,12,19,20,24,25,27,28,29,30,31,31),
15 heat-day(s) (highest temp. at least 30 °C) (01,02,03,04,05,06,07,08,10,18,19,24,27,28,31),
2 tropical night(s) (lowest temp. at least 20 °C) (02,03).
The dewpoint was in the average of the month at 15.44 °C.
The highest dewpoint was reached on 28.07 at 11:30 with 22.10 °C.
The lowest dewpoint was measured on 17.07 at 01:10 with 8.80 °C.
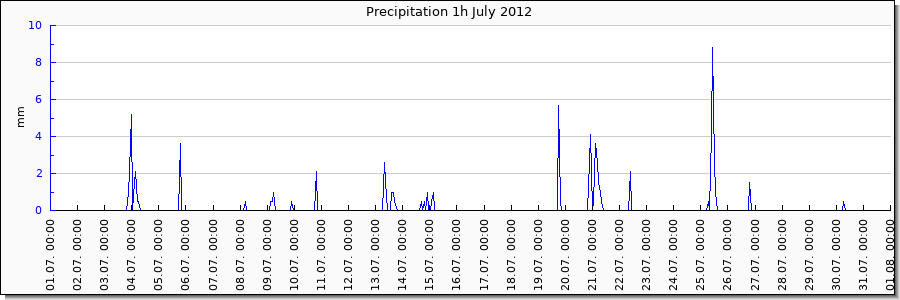
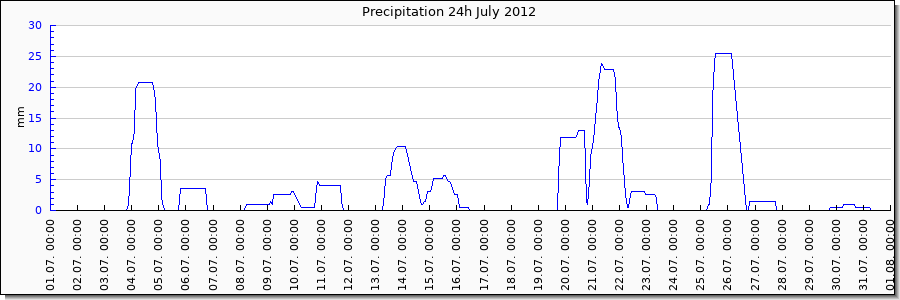
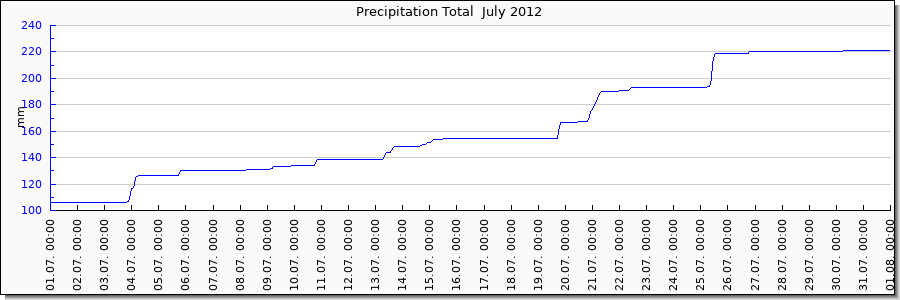
There was a precipitation of 115.50 mm, 172.39 % of the long-time average of 67 mm.
The day with the most precipitation was 25.07 with 25.40 mm.
No precipitation happened on 14 day(s) (01,02,06,07,11,12,16,17,18,23,24,27,28,31).
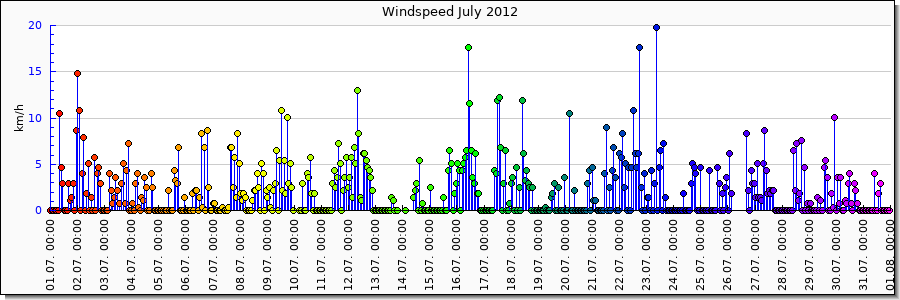
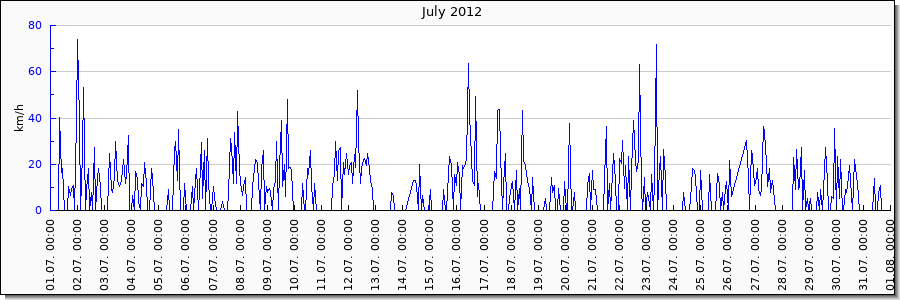
The average windspeed in July was 2.12 km/h (1 bft - Light Air).
The strongest wind was measured on 18.07 at 15:50 with 23.04 km/h (4 bft - Moderate Breeze).
The windiest day was 12.07 with an average windspeed of 4.92 km/h (1 bft - Light Air).
The day with the least wind was 13.07 with an average of 0.09 km/h (0 bft - Calm).
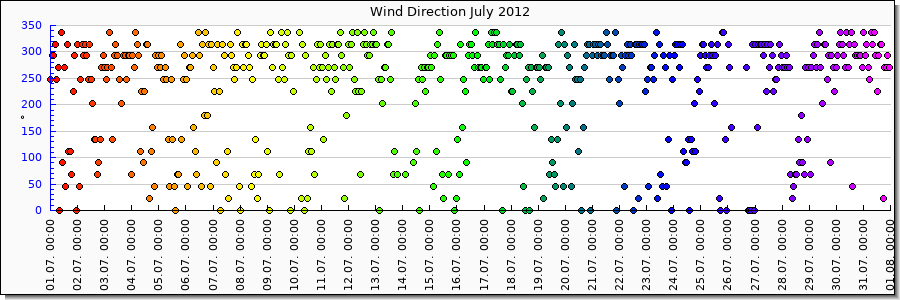
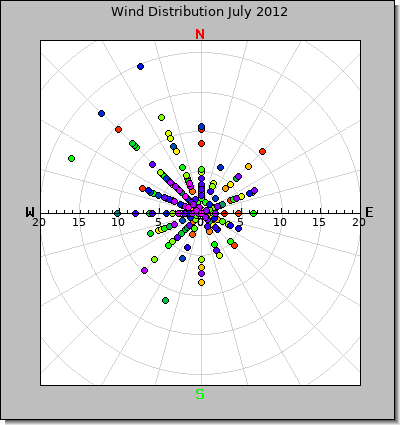
The wind came most of the time from South-West (228.06).
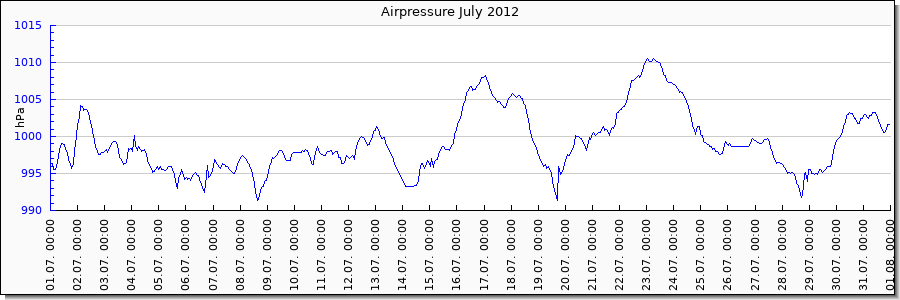
The average, to normal zero reduced airpressure was at 999.28 hPa.
The highst airpressure was measured on 23.07 at 00:10 with 1010.70 hPa.
The lowest airpressure appeared on 19.07 at 16:40 with 991.10 hPa.
Graphs for July 2012.
 Warning: Undefined array key "windmax" in /home/.sites/327/site3343342/web/wetter/weatherInclude.php on line 599
Top
Average Values for July 2012.
| Date | Time | Temp In (°C) | Temp Out (°C) | Dew (°C) | Hum In (%) | Hum Out (%) | Windspeed (m/s) |
Warning: Undefined array key "windmax_table" in /home/.sites/327/site3343342/web/wetter/weatherInclude.php on line 730
| Wind Angle (°) | Wind Chill (°C) | Airpressure (hPa) | Rain 1h (mm) | Rain 24h (mm) | Rain overall |
| --.--.-- | --:--:-- | 21.67 | 21.81 | 15.44 | 62.31 | 68.99 | 0.59 | 2.68 | 228.06 | 21.73 | 999.28 | 0.15 | 3.37 | 162.04 |
Top
Minimum Values for July 2012.
| Date | Time | Temp In (°C) | Temp Out (°C) | Dew (°C) | Hum In (%) | Hum Out (%) | Windspeed (m/s) |
Warning: Undefined array key "windmax_table" in /home/.sites/327/site3343342/web/wetter/weatherInclude.php on line 730
| Wind Angle (°) | Wind Chill (°C) | Airpressure (hPa) | Rain 1h (mm) | Rain 24h (mm) | Rain overall |
| | 20.30 | 12.40 | 8.80 | 58.00 | 33.00 | 0.00 | 0.00 | 0.00 | 10.90 | 991.10 | 0.00 | 0.00 | 105.70 |
| Time | 05:30:15 | 04:30:16 | 01:10:36 | 01:10:36 | 18:40:12 | 00:00:29 | 00:00:29 | 07:20:32 | 05:20:34 | 16:40:34 | 00:00:29 | 00:00:29 | 00:00:29 |
| Date | | 2012-07-21 | 2012-07-17 | 2012-07-17 | 2012-07-17 | 2012-07-02 | 2012-07-01 | 2012-07-01 | 2012-07-01 | 2012-07-23 | 2012-07-19 | 2012-07-01 | 2012-07-01 | 2012-07-01 |
Top
Maximum Values for July 2012.
| Date | Time | Temp In (°C) | Temp Out (°C) | Dew (°C) | Hum In (%) | Hum Out (%) | Windspeed (m/s) |
Warning: Undefined array key "windmax_table" in /home/.sites/327/site3343342/web/wetter/weatherInclude.php on line 730
| Wind Angle (°) | Wind Chill (°C) | Airpressure (hPa) | Rain 1h (mm) | Rain 24h (mm) | Rain overall |
| | 23.80 | 38.80 | 22.10 | 66.00 | 91.00 | 6.40 | 25.90 | 337.50 | 38.80 | 1010.70 | 12.90 | 25.40 | 221.20 |
| Time | 15:30:23 | 18:40:23 | 11:30:34 | 12:10:11 | 02:20:18 | 15:50:22 | 22:20:12 | 00:10:33 | 18:40:23 | 00:10:32 | 10:10:13 | 12:40:12 | 06:30:14 |
| Date | | 2012-07-08 | 2012-07-01 | 2012-07-28 | 2012-07-01 | 2012-07-21 | 2012-07-18 | 2012-07-01 | 2012-07-01 | 2012-07-01 | 2012-07-23 | 2012-07-25 | 2012-07-25 | 2012-07-30 |
Top
Show all values
Go to: June 2012 or August 2012